

What Bond Yield Curves Reveal About Stock Valuations
Bond yield curves rarely move in isolation. When they steepen, flatten, or invert, they are usually telling investors something about growth, inflation, policy expectations, and risk appetite. That matters for equities because stock valuations are built on the same forces: the level of interest rates used to discount future earnings, the outlook for corporate profits, and the market's willingness to pay up for those profits today. In other words, the yield curve is not a perfect stock-market signal, but it is one of the clearest windows into the environment in which valuations are formed. For readers following broader market structure, it also connects naturally with themes covered on stock markets, economy, and investment.
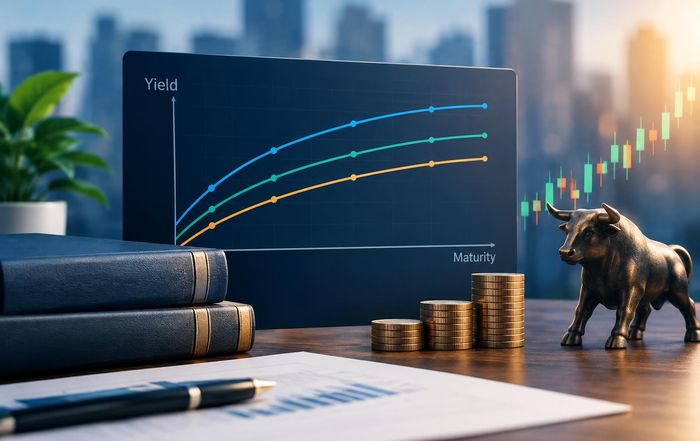
The basic relationship is straightforward. A yield curve plots interest rates across maturities, most often from short-term Treasury bills to long-term government bonds. In the United States, the U.S. Treasury publishes the curve, while central-bank policy expectations are shaped by the Federal Reserve. When investors expect weaker growth or easier monetary policy, short-term yields can fall relative to long-term yields, flattening or even inverting the curve. When they expect stronger growth, inflation pressure, or tighter policy, the curve often steepens. Equity valuations respond because higher yields raise the discount rate applied to future cash flows, and because the curve often reflects whether the market expects those cash flows to grow or stall. That is why yield-curve moves often show up first in sectors sensitive to rates, including financials, technology, and cyclical industries.
Why the curve matters more than a single interest rate
A common mistake is to focus only on the policy rate set by a central bank. The curve is richer than that because it shows how markets price time, uncertainty, and policy across different horizons. A two-year yield is heavily influenced by near-term central-bank expectations, while a ten-year or thirty-year yield embeds beliefs about inflation, growth, fiscal conditions, and term premiums. That distinction matters for valuation. A company with earnings expected far into the future-many growth stocks fit this profile-tends to be more sensitive to long-duration discounting than a mature business that generates cash today. When long-term yields rise, the present value of distant earnings can fall even if the company's business outlook has not changed. For a broader view of how markets interpret this, it helps to track banking, global, and news developments together rather than in isolation.
The curve also provides a useful cross-check on equity optimism. If stock prices are rising while the curve is flattening sharply, the market may be pricing a future in which earnings growth slows and policy support eventually arrives. If stocks are expensive and the curve is steepening because inflation expectations are climbing, the market may be tolerating higher nominal growth but also a more demanding rate environment. Neither condition automatically predicts a correction, but both can expose valuation fragility. Investors often talk about price-to-earnings ratios as if they were fixed measures, yet the yield curve reminds them that a "high" multiple can be reasonable in one rate regime and stretched in another. That is especially relevant when comparing market leadership across sectors, including themes often discussed under technology and artificial intelligence, where future cash flows are often priced aggressively.
Inverted curves and what they can, and cannot, say about stocks
An inverted yield curve, where short-term yields exceed long-term yields, has a strong reputation as a recession warning. That reputation is not baseless. Historically, inversions have often preceded downturns because they reflect expectations that central banks will need to cut rates in response to weaker growth or lower inflation. When the curve inverts, equity valuations can become more vulnerable because profit forecasts are often still too optimistic relative to the macro signal embedded in bonds. Investors may continue to bid up stocks for a while, but the margin for disappointment narrows. This is one reason market strategists watch the curve alongside earnings revisions, credit spreads, and labor-market data from institutions such as the Bureau of Labor Statistics and the International Monetary Fund.
Still, an inversion does not mean stocks must fall immediately. Equities are forward-looking, but they can remain detached from bond signals for months, sometimes longer. The lag matters. In some cycles, the market initially focuses on still-healthy profits, robust household balance sheets, or enthusiasm for a narrow set of winners, while bonds are already signaling stress beneath the surface. In other cycles, the curve inverts for reasons that are less damaging to equities, such as a temporary surge in inflation expectations or an unusually strong demand for long-dated safe assets. The right interpretation is therefore probabilistic, not mechanical. The curve raises the odds that valuations will be harder to sustain, but it does not provide a timing tool precise enough to trade on its own.
Steep curves, cyclical optimism, and valuation breadth
A steepening curve usually tells a different story. When the spread between short and long rates widens, markets are often signaling that growth may improve, inflation expectations may be firming, or the central bank may be near the end of a tightening cycle. In equity markets, that environment tends to support cyclicals, banks, industrials, and some smaller companies that depend on easier credit conditions. It can also broaden market participation beyond a handful of long-duration growth names. That does not automatically mean valuations become cheap, but it can change which sectors deserve higher multiples. For readers tracking sector rotation, the interaction with founders, business, and marketing trends can be especially relevant when capital access and consumer demand are shifting together.
A steep curve can also hide a valuation warning of its own. If it steepens because long-term inflation expectations are rising faster than growth prospects, equities may face a tougher combination: nominal rates move higher, discount rates rise, and earnings multiples compress even if revenue growth looks stable. That is why investors should not treat a steep curve as uniformly bullish. The key is to ask what is driving it. Is the market pricing better real growth, or more inflation compensation? Is the long end rising because fiscal deficits are expanding, term premiums are normalizing, or investors are demanding more yield to hold duration? Those distinctions matter for stock valuations because they shape both the discount rate and the durability of earnings.
How valuation models translate bond signals into stock prices
At a technical level, bond yields affect stock valuations through discounted cash flow logic. The higher the risk-free rate, the lower the present value of future earnings, all else equal. This is most visible in growth-heavy sectors where a large share of value sits far in the future. It is less dramatic for companies that return cash quickly through dividends or buybacks. But the curve also influences the equity risk premium, which is the extra return investors demand for holding stocks instead of government bonds. When bond yields are low, investors may accept lower equity yields and higher valuation multiples. When bond yields rise, the bar moves higher. That means the yield curve can affect stocks even when corporate fundamentals are unchanged.
This is also why valuation discipline becomes more important in periods of rapid rate change. A stock that looked inexpensive at a 1% ten-year Treasury yield may look much less attractive at 4% or 5%, even if earnings are growing. The market is not simply punishing companies; it is repricing the alternative available to investors. Government bonds become more competitive, especially for institutions that need income and capital preservation. The same logic helps explain why some asset allocators rebalance away from equities when yields rise sharply. For a broader macro lens, it is worth watching how this plays into banking margins, investment allocations, and broader economy conditions.
What investors should watch beyond the curve itself
The yield curve is most useful when paired with other indicators. Earnings revisions show whether companies are actually feeling the macro shift. Credit spreads reveal whether bond investors are worried about default risk beyond government debt. Inflation data from official statistical agencies and central banks helps explain whether rate moves are responding to price pressure or to weakening demand. Labor-market indicators, consumer confidence, and purchasing-manager surveys add further context. On a global basis, yields in the Bank for International Settlements framework, policy signals from the European Central Bank, and market developments in the Bank of England can all influence cross-border capital flows and valuation comparisons. For international readers, that matters because U.S. equities do not trade in a vacuum; they compete with returns available in other major markets.
The practical takeaway is that the yield curve should be treated as a valuation context tool, not a standalone forecast. When the curve is signaling slower growth, expensive equities are more vulnerable than cheap ones, and companies with distant cash flows are more exposed than those with near-term earnings power. When the curve is steepening for healthy reasons, valuation breadth often improves and cyclicals may gain relative strength. When it steepens for inflationary reasons, the market can face a more complicated mix of nominal growth and multiple compression. Investors who understand those distinctions are better positioned to interpret whether stocks are being supported by fundamentals or by a temporary willingness to ignore bond-market warnings. In that sense, the curve is less a prediction machine than a stress test for equity valuations-a way of asking whether the prices investors are paying still make sense in the rate environment ahead.